
When building data apps and dashboards with Observable Framework, you can write data loaders — programs that access, wrangle, or analyze data, then generate a static data snapshot at build time.
Data loaders may initially feel constraining for developers (including Observable notebook users) who are used to accessing and querying real-time data on the client, e.g. via fetch. In fact, that’s how many of us on the Observable Team felt when we got started with data loaders. Now, we embrace data loaders as a “win-win-win” for building data apps and dashboards in Framework: a win for polyglot developers and teams, a win for performance, and a win for decision makers.
A data loader is a program that generates static files at build time. Data loaders can be written in any language (e.g. Python, JavaScript, SQL, R, Julia, or anything else). In fact, a data loader can be literally any program that: (1) runs on the computer that builds the project, and (2) is able to output information to standard output.
Most often, data loaders generate snapshots of pre-processed data. For example, a data loader might:
Perform time series forecasting of web traffic in R using recent data from a secure API, then output an Apache Parquet file with both the historic and forecasted values
Access customer data from a company database, query records using SQL to only include customers who have been active on a site in the past 30 days, then emit a CSV file
In Python, read in remote sensing data from the Landsat 8 satellite, clip the data to a specific field study area, visualize the color infrared image, and generate a PNG
You’ll recognize data loaders in Framework projects by their double extension, indicating the output type followed by the loader type. For example, user-traffic.json.py is a Python data loader that prints out a single JSON file, while energy-demand.zip.R is an R data loader that emits a zip archive.
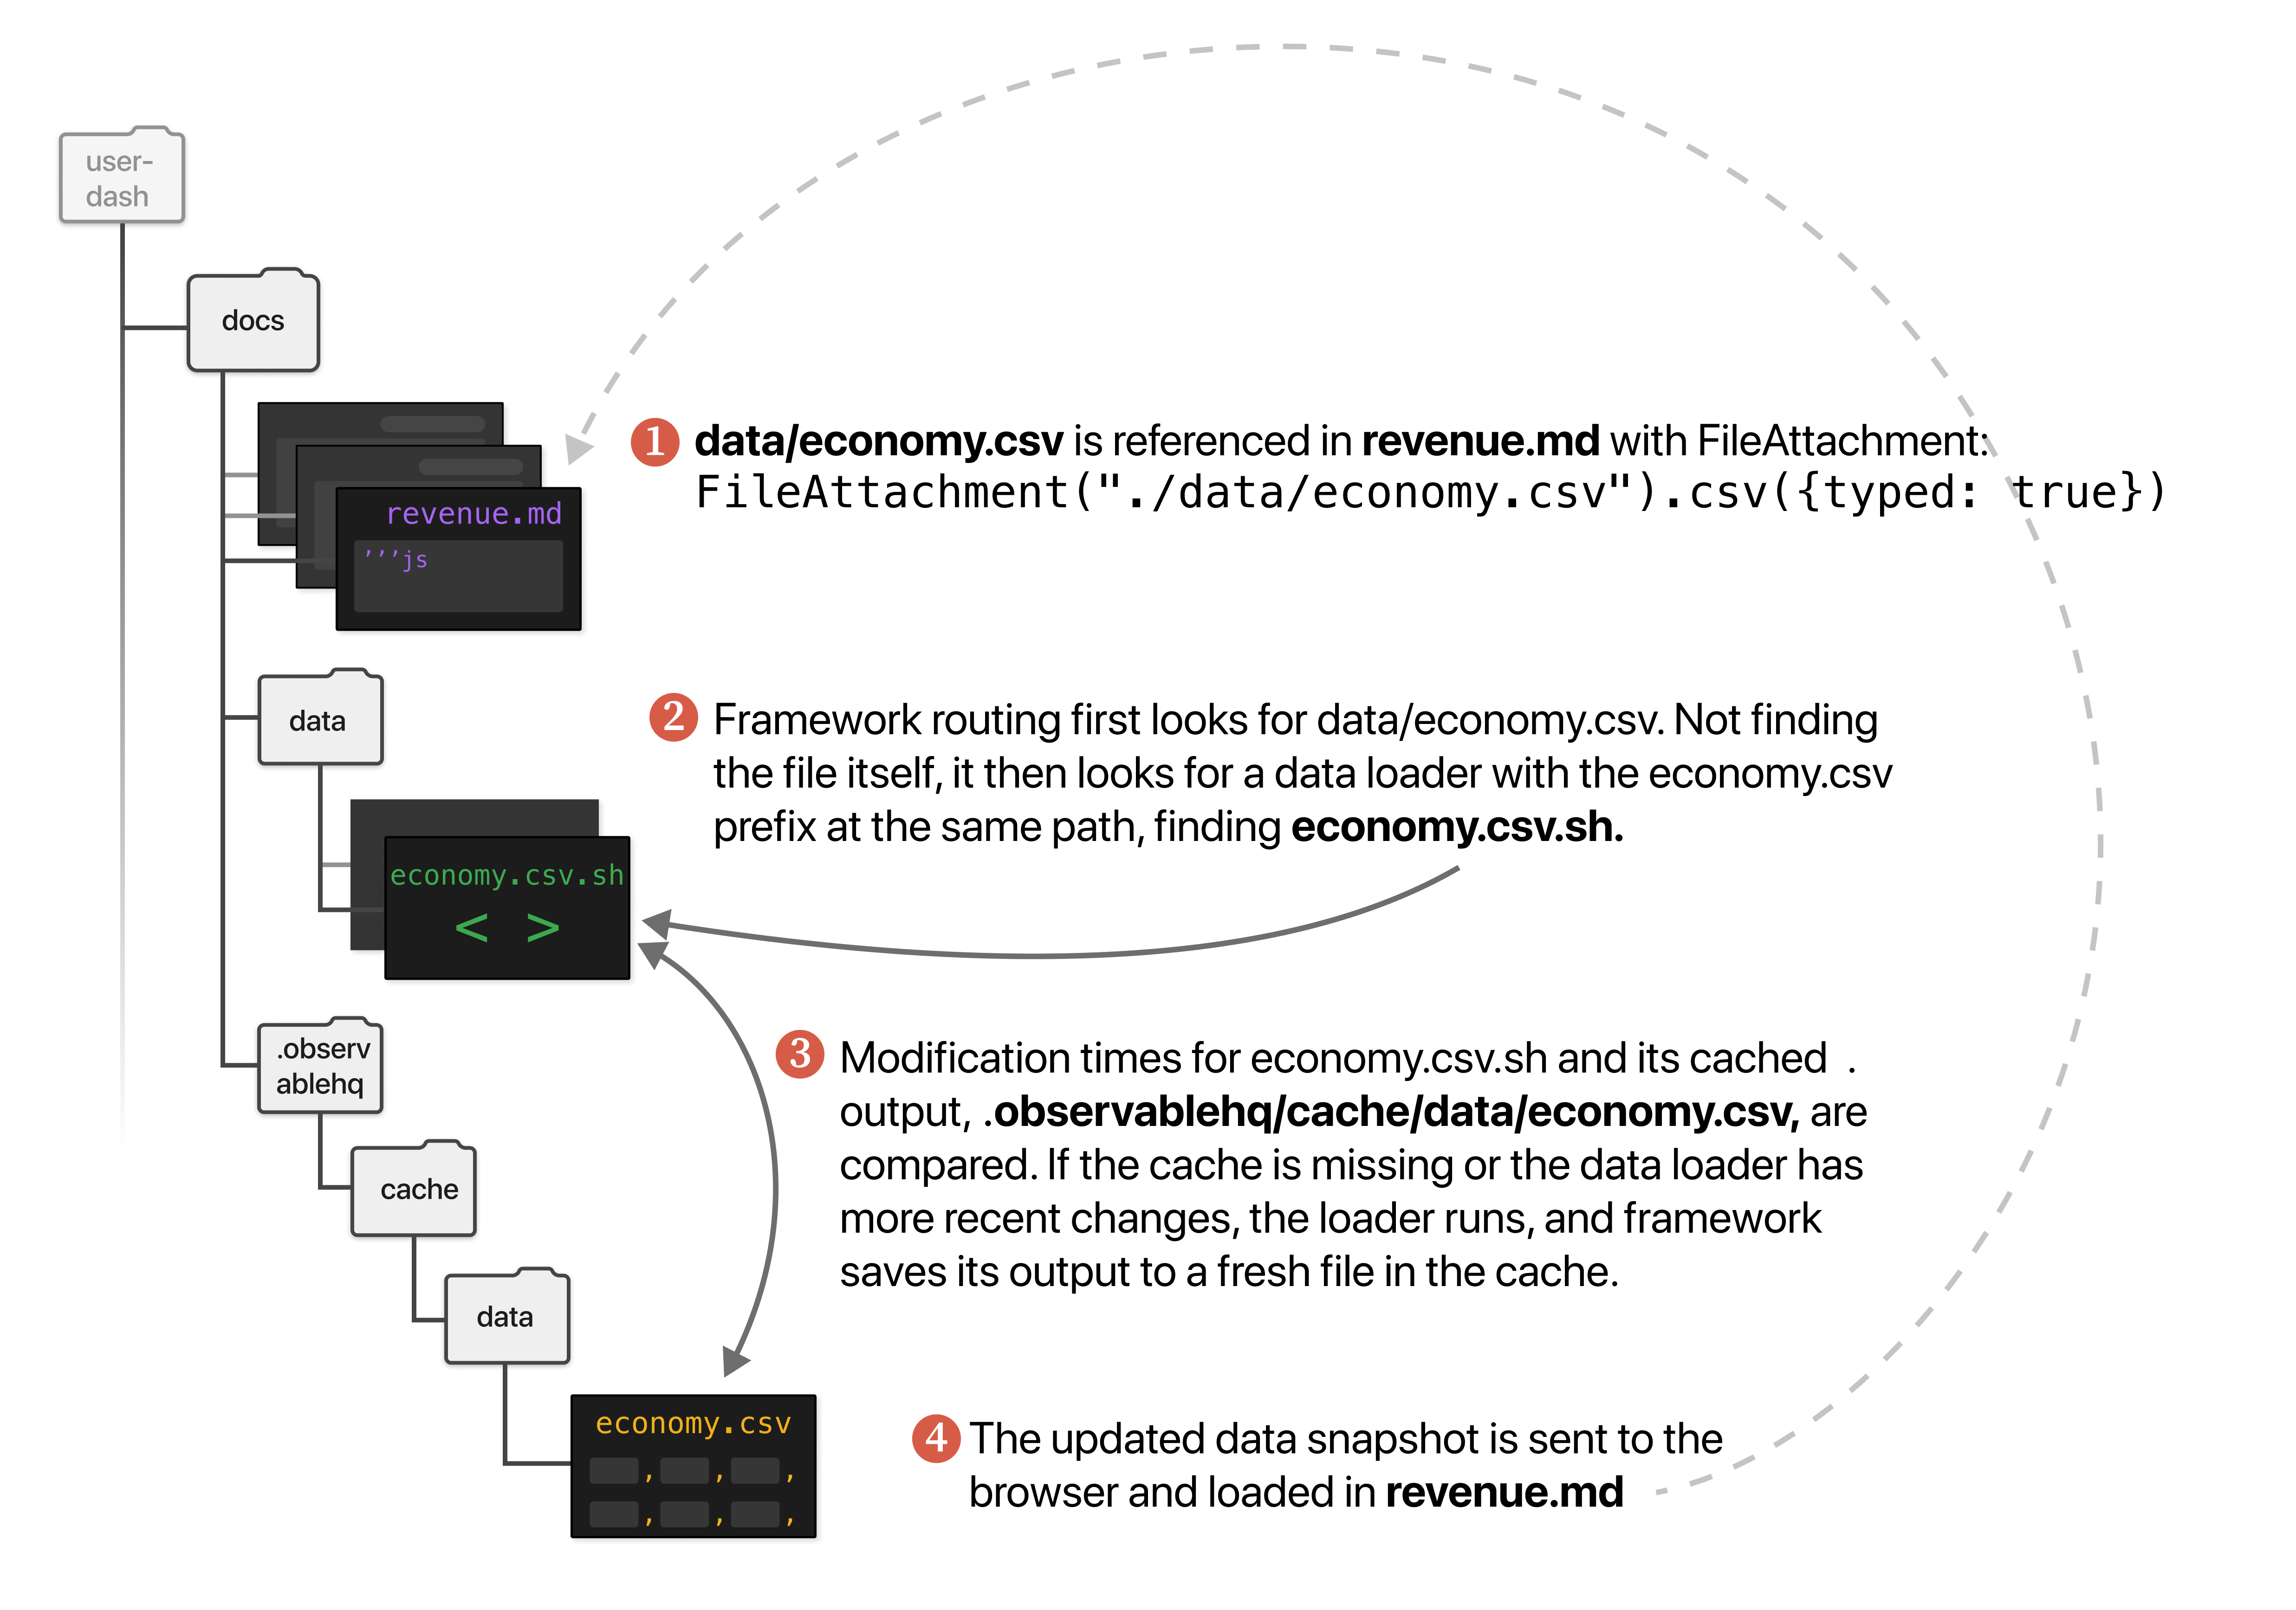
When you reference a data file from a markdown file (e.g. with FileAttachment), Framework’s routing will first look for that file, then (if the file isn’t found) for a data loader with the matching prefix. If the data loader has been updated more recently than the cached output in docs/.observablehq/cache, the loader runs again and generates an updated version of the data snapshot, which gets read in by FileAttachment.
Let’s consider a hypothetical example. We wrote a .sh data loader that accesses an organization’s user account data from a secure database, queries records to only include certain types of accounts (say, from the economy tier), then returns the individual account ID, creation date and total lifetime revenue in a single CSV. We add the data loader to docs/data/ as economy.csv.sh.
The schematic below describes the sequence of Framework steps taken when we reference economy.csv in revenue.md:
Data loader outputs don’t just integrate with Framework at build time. Local changes to data loaders are detected by the preview server and pushed to live preview, so you can see page updates while you develop your site, your data analyses and your visualizations.
JavaScript is the language for modern data visualization and interactive graphics on the web. But the bulk of data work isn’t creating stunning graphics and polished dashboards — it’s accessing, wrangling, exploring, analyzing, and modeling data. Those tasks are most commonly done in languages like Python, SQL, or R.
Data loaders bridge the language gap between data prep and data displays because they can be written in any language, which means that developers and their team can extract and model data using whatever language and libraries they love. A number of data loader types, including Python, R, TypeScript, JavaScript, Julia, Rust, Go, and more are built into Framework for convenience (see the default list of interpreters).
Don’t see your language of choice? Don’t worry! You can use the interpreters configuration option to specify any additional interpreted languages for data loaders. For example, adding the following to your project’s configuration file lets you write Ruby data loaders using extension .rb (e.g. customers.json.rb):
export default {
  interpreters: {
    ".rb": ["ruby"]
  }
};
You can write data loaders just like you would a normal script, with the additional requirement that the payload must be sent to standard output. It’s not always obvious how to do that in different languages, or for different output types. For example, in an R data loader you could write a CSV from a data frame stored as myData to standard output using cat and readr::format_csv:
cat(format_csv(myData))In Python (from pandas DataFrame myData), you could use:
myData.to_csv(sys.stdout)And in Node (with array myData created in a JavaScript data loader):
process.stdout.write(d3.csvFormat(myData))Note: console.log also writes to standard output, so beware when using console.log (e.g. for debugging) in data loaders as it can inadvertently add logged messages to your loader output. You can still debug a data loader by sending messages with console.warn instead, which will be shown in the preview logs.
If you’ve ever monologued your way through a presentation featuring a slowly-loading dashboard, you know how long seconds can feel. Users expect instant page loads. While there are no absolute rules for what is classified as “fast” or “slow” in web performance, what we can say is that when it comes to page loads, faster is better.
Data loaders can speed up dashboards and apps built with Framework in two ways.
First, data loaders can perform time-consuming data wrangling and analyses at build time, reducing the (sometimes slow) client-side processing needed when a viewer opens a page. In our internal web log analysis dashboard (see the public version), a TypeScript data loader cuts page load times by performing complex database queries in SQL to generate an Apache Arrow file with records for >7 million server requests. This pushes all the heavy data processing to build-time, resulting in fast page loads — especially considering the richness of the rendered charts.
You might be thinking “Wait, doesn’t that just mean you’ll have a longer build time?” Yes! We like that tradeoff. We use automated, scheduled builds to keep the web log dashboard up-to-date (or, as up-to-date as we need it to be for our purposes), with near-instant page loads. The longer daily builds happen once a day, behind the scenes — not every time someone opens the dashboard on their mobile phone.
Second, data loaders can be tailored to minimize the size of data sent to the client. In a data loader, you might filter data to only include recent dates, select just the variables you need for a visualization, store model outputs for selected scenarios, or aggregate raw data into summary statistics. And, you might reduce a file size in a data loader simply by converting it to a parquet file, or compressing multiple outputs as a Zip archive.
Returning to the hypothetical economy.csv.sh data loader from the schematic above, we minimize the data by:
Filtering to only include active Economy Tier user records
Aggregating revenue values to return only the lifetime sum
Keeping just three columns: account ID, creation date, and lifetime revenue
Bonus win: Data minimization is also good for data privacy and security, since only information in the generated snapshot gets shared with viewers (but “data loaders for the win-win-win-win” just felt like a bit much 🙂).
It’s tempting to build dashboards that pull in real-time data updated by the minute, or that allow viewers to explore changes in model outcomes at tiny increments along a range of parameter values. And with Framework, you can absolutely still do that.
But do dashboards that allow nearly limitless, real-time data exploration help or hinder the users they’re frequently made for: business decision-makers and managers operating with limited time, and perhaps with a less robust understanding of the data and methods underlying a data visualization?
We’d argue the answer is often “hinder.” As Observable founder Mike Bostock recently wrote:
It first felt counterintuitive and constraining to prepare data ahead of time, rather than just loading whatever you want on the fly. But we’ve found this to be a great discipline in practice because it forces you to think about what data you actually need to show.
Most of us on the Observable Team were used to working in Observable notebooks, which we love for on-the-fly testing and tinkering with live data. While that nimble, real-time data investigation in notebooks is an essential part of data exploration and prototyping, it can also be a bit more haphazard than a thoughtful, “less is more” approach for building useful dashboards.
Now working in Framework to create finalized and sustained data displays, we embrace a good side-effect of data loaders: they nudge us toward more carefully planned, and more strongly opinionated, data apps and dashboards. That translates to dashboards tailored for decision-makers to quickly focus on the most important scenarios, key trends, and critical comparisons, rather than sifting through an interactive data haystack.
Nope! Data loaders aren’t mandatory in Framework projects, and sometimes aren’t even the best option. For example, you can drop CSV files (or anything else) right into your project directory for use. Or, get real time data on the client, e.g. via fetch or WebSocket.
In fact, we use a combination of data loaders and static files in our own Framework projects and examples. Our U.S. electric grid dashboard uses a static JSON file for the U.S. base map, several (non-data loader-generated) CSVs for unchanging reference information on balancing authorities, and JavaScript data loaders to access hourly electric data from the Energy Information Administration’s Opendata API.
If you’re new to data loaders, we’ve got you covered:
Follow along with our Getting started tutorial for a step-by-step introduction to Observable Framework, including how to create, modify, and use the output from a data loader to explore your local weather
Watch our short video on writing your first data loader, which follows the example from the tutorial above
Read the Data loaders section in our Framework documentation for a technical overview and examples
Explore our public examples to see how we use data loaders in our projects
If you aren’t yet using Observable Framework, data loaders are one great reason to try it out. Learn more about Framework at observablehq.com, and create your first project today!